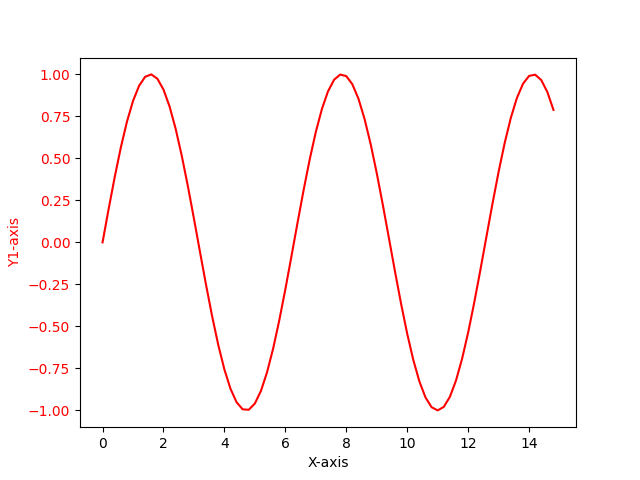
指定轴取值范围以及显示轴刻度
实现
# Import Library
import numpy as np
import matplotlib.pyplot as plt
# Define Data
x = np.arange(0, 15, 0.2)
data_1 = np.sin(x)
# Create Plot
fig, ax1 = plt.subplots()
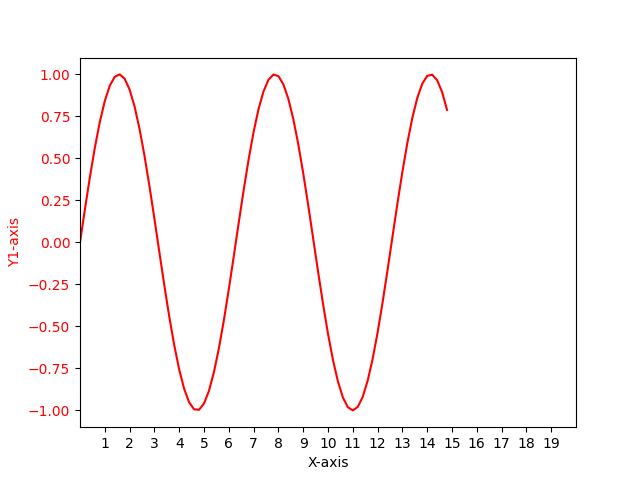
# ## Get current axis info
# print('xlim:', ax1.get_xlim())
# print('ylim:', ax1.get_ylim())
# print('xticks:', ax1.get_xticks())
# print('yticks:', ax1.get_yticks())
#
# ## Set axis
# xticks = np.arange(1, 20, 1)
# xlim = (0.0, 20.0)
# print('set xlim:', xlim)
# print('set xticks:', xticks)
# ax1.set_xlim(xlim)
# ax1.set_xticks(xticks)
ax1.set_xlabel('X-axis')
ax1.set_ylabel('Y1-axis', color='red')
ax1.plot(x, data_1, color='red')
ax1.tick_params(axis='y', labelcolor='red')
# Show plot
plt.show()
显示
相关阅读